
How the league table lies…
On Friday evening, we ran a poll on Twitter asking PSL fans their thoughts on whether the league table lies.
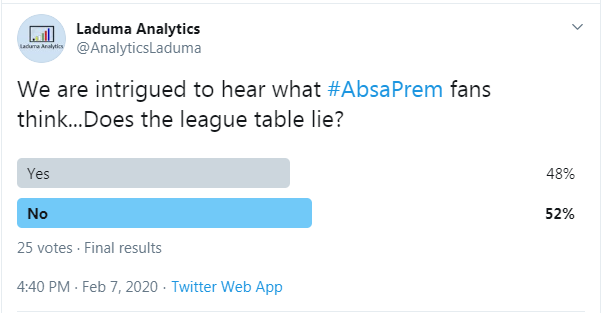
When we asked this question, we thought an overwhelming majority would have said no. However, as you can see it was very close. Spoiler alert….the league table in football can be deceptive, and let us tell you why. Yes, the points acquired by teams throughout a campaign are true, yet the table does not reflect how a team really performed. Any team can have a great game and still come away with 0 points whilst the opposite is also true.
A metric know as Expected Goals (xG) is used to help breakdown the quality of shots taken by teams in a match. After all, you have to shoot in order to have a chance of scoring, which in turn affects if you win/draw/lose the game. xG – each shot has a probability assigned to it that it results in a goal (click the video linked above). Then using simulations (usually run in their thousands) of the match, a scoreline is established based on these xG values.
For example, at a very high level shots from these specific areas are be assigned a probability value of resulting in a goal. Now these values change, the more variables that are considered, ie: distance of shot, angle, pressure on shooter, type of play and so many more. From this, we can work out which teams ‘deserved’ how many ‘expected points’ (xPts).
| 6-yard box | 18-yard box | Outside the box |
| 34% | 19% | 3% |
| One in every 3 shots results in a goal | One in every 5 shots results in a goal | One in every 33 shots results in a goal |
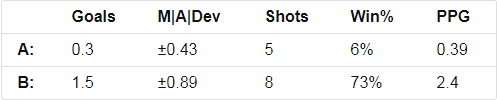
Forgive us for this next part is a small bit mathematical…let’s take the Soweto derby as an example. Pirates beat Kaizer Chiefs 2-1 but Kaizer Chiefs dominated the game from end to end. The xG data suggests that the game should have ended with Kaizer Chiefs winning the game based on them taking more quality shots which ended in goals. If this game was played a thousand times over, Chiefs would have won the game 73% of the time, Pirates 6% and a draw 21% of the time. Yes, Pirates have the all important maximum three points but really only have 0.39 expected points.
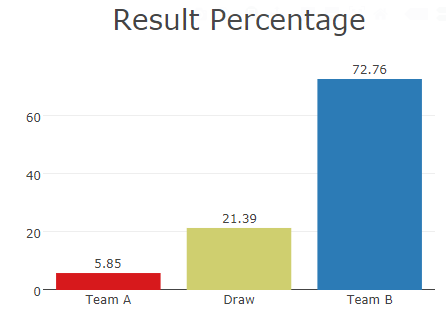
How did we get to 0.39 expected points?
3 points x 0.06 (6%) = 0.18 & 1 point x 0.21 (21%) = 0.21 = 0.39 expected points
Phew, maths lesson is over!
Thus, over time, for each game, we can build a profile of a team’s real performance (both for and against) and use this to build an expected (xPts) table. This table is by no means perfect/ideal but it does capture predictive patterns which can be used to establish where your PSL club is really sitting in the table.
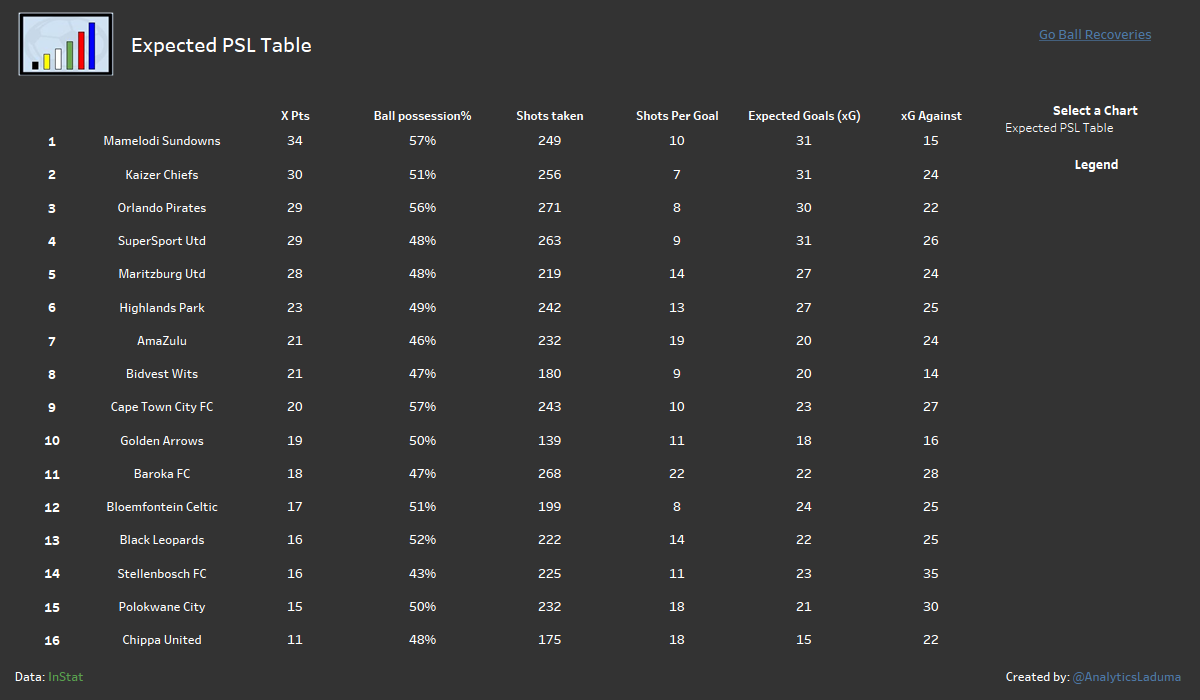
The xG table data is intriguing for a number of reasons.
- Despite Kaizer Chiefs great run of form, they are out-performing expectations. On initial examination, this is down to them scoring more goals than we would have expected, whilst defensively they are conceding less than expected based on the shots they have faced.
- AmaZulu are the biggest movers up the table and should really be in safer hands than they currently find themselves in. They truly have struggled with goal scoring (they should have approx 20 goals; they only have 12).
- The top teams take less shots to score on average (Kaizer Chiefs, Orlando Pirates & Bidvest Wits), whilst Baroka take a whopping 22 shots to score a goal.
And we know why….their shot quality and conversion rate is terrible.
How to read the graph:
Examine the relationship between using Expected goals (xG) per Shot – which examines the likelihood that a shot becomes a goal & a team’s overall ability to convert shots into goals.
The best place to sit on this graph is TOP RIGHT.

We offer detailed statistical analysis of the PSL. Please visit our Consultancy page for more information.
Comments (1)
Passport Overused
Great post 🙂