
Team Dashboards
By Alex Rathke
Yesterday, we released our first ever team focused dashboard. This was posted on our Tableau Public page and allows users to interact with the visuals across a variety of different metrics. These include 1. Shots Taken; 2. Shots Faced; 3. Shots on Target; 4. Goals Scored; 5. Expected Goals; 6. Expected Points; 7. Possession statistics and 8. Pressure metrics. A visual of the workbook can be found below.

As of right now, we will examine a few of the metrics and explain what they may be telling us about the teams. Let’s start with Shots on Target% (SoT%). The definition for SoT is as follows:
1. SoT%: “the number of shots on target by a team divided by the number of shots taken by that same team”.
For example, SuperSport United have a 25% SoT rate which means that they arguably could have taken 100 shots but only 25 of these were on Target. The interesting aspect about SoT% is that figures vary early into the season and over a short period of time. However, over an extended period of time, teams normally sit around the 30% rate. Really good teams can hit 35%…40% and over is lucky and won’t last long.
2. Shot Analysis
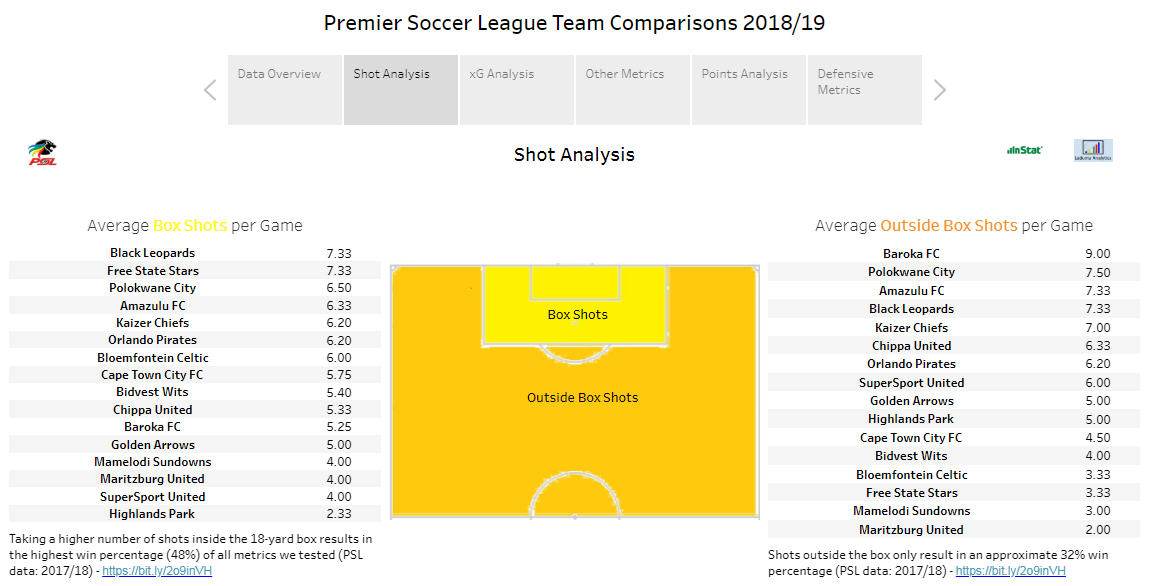
These should be fairly simple. The closer to the goal that teams take their shots, the higher the chance that these will be on target and converted into goals. Ideally, teams should limit their shooting chance from outside the box due to their low probability of scoring. In terms of Expected Goals (xG), we have provided some reading material inside the dashboard.
3. Expected Points (xPts)
This can be can tricky and can be measured in many different ways. Unfortunately, we cannot reveal our method (some things have to stay a secret). Either way, (at this moment in time) a few teams are overperforming and some are underperforming xPts. Bidvest Wits, for example, are overperforming xPts by 6 points while Kaizer Chiefs are underperforming by 3 points. How and why?
Bidvest Wits: Taking on average 9 shots per game is not great. On average, it takes 9 – 10 shots to score a goal. Wits are clearly behind the mark here and yet they are taking their shots from good locations (inside the 18-yard box). Their conversion rate is also currently at 40.24%. While we have not examined every one of their shots in detail, we can only go by what the numbers are currently telling us. Down, or otherwise known as “they will soon revert to the mean”.
Kaizer Chiefs: are on the other hand currently shooting 4 more times per game with a much healthier SoT% of 29.17%. Their shot locations are also pretty neat with just over 50% of their shots coming from inside the box. In terms of xG to goals scored, they are in a healthy state of balance. Defensively (unlike Wits), they are coming up just short at present with conceding two more goals than what we would have expected them to.
4. League Table
The league table does lie. How? Read about it here.

That is as much as we will cover for now. Christmas came early and secrets are expensive!