
The illusion of “chances created”..
Can taking multiple shots result in a false positive?
Let’s kick this off with definitions…
Chance created:
- The final pass from a player to a teammate, who then makes an attempt on goal
Nearly every football metric has its shortfalls and limitations. Chances created is no exception. Take this stat, for example:
The mind immediately leaps to assume the player made 10 incisive passes that opened up the defence and left their teammate with a reasonable chance to score. It could easily be that 10 of his passes were received by players who ran out of ideas and decided to take a wild shot (when another pass was a better option), or 10 of his pass recipients went on mazy dribbles past six players before taking a shot. The truth lies somewhere in between.
Did Chiefs create the most chances in the league?
Short answer: Yes. Long answer: there’s nuance. Overall, Chiefs led the league in chance creation (and, concerning the above definition, led the league in the proxy stat: shot taking). They led this statistic all season, but even that has ebbed and flowed. At the end of 2024, Chiefs were taking 16.3 shots per game (1st in the league). This year, that has dipped to 12.4 per game, just good enough for 5th best. Immediately, the statement that Chiefs create the most chances begs a deeper look – there were periods when they did, and periods where they didn’t.
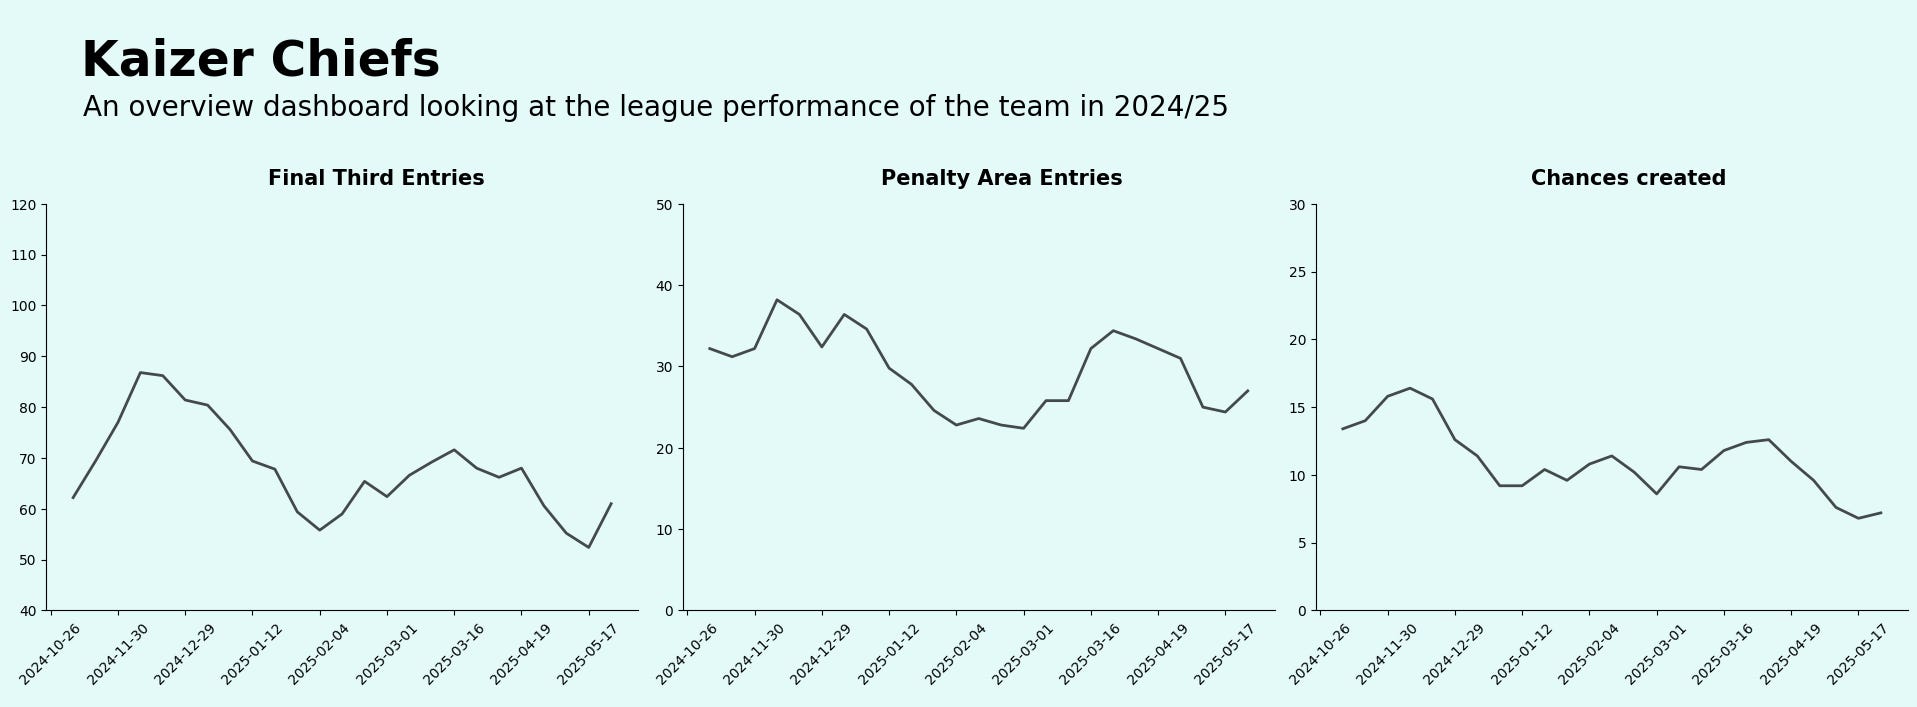
Not all shots and not all chances are created equally, so the quantity of chances created should also be paired the quality of these chances created. The causes (of the decrease) are many – less final third entries, penalty area entries etc. (see above).
Look 13 shots a game is still above average, but when that number dips, especially without quality to make up for it – a significant underperformance in attack becomes inevitable. It’s been 4 months and 17 league games since Chiefs scored more than once in a game (excl. own goals).
Compare this with champions Sundowns, whose volumes were so low in the first half the season (9.8 shots per game in 2024 was 5th-lowest in the league), yet the low volumes were offset by efficiency and high quality. Chiefs didn’t have enough of either efficiency or high quality, meaning they have less margin for error either way. Whereas Sundowns can win games with 10 or fewer shots on the board (they’ve done that 9 times this season in the league – more than any other team). Chiefs have done so twice, the fewest of all teams.
Not many other teams have that luxury of “underperforming” in front of goal, especially a team that isn’t creating high-quality openings. Downs didn’t create the most chances in the league for a long time. They were third overall behind both Chiefs and Pirates at the end, but set a new PSL record for goals in a season. xG can partially explain this, but even then, the overall xG figure doesn’t paint the full picture.
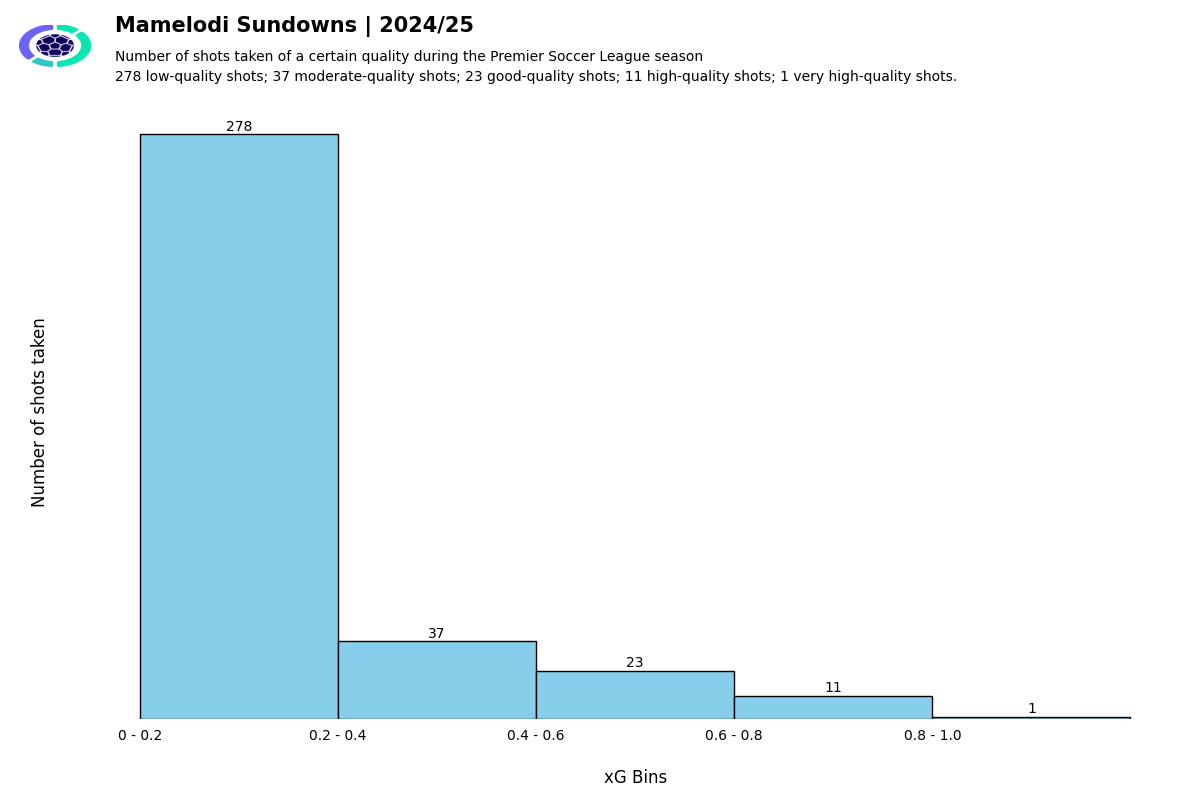
Enter xG bins. The xG bins go beyond aggregating xG, but group a team’s shots by quality, with the lowest quality shots in the longer bar, and improving as the graph tails off. A thicker tail indicates that a team has a bigger proportion of higher-quality shots. 21% of Sundowns’ shots can be considered moderate-quality to very high-quality. For Chiefs, that’s only 12%.
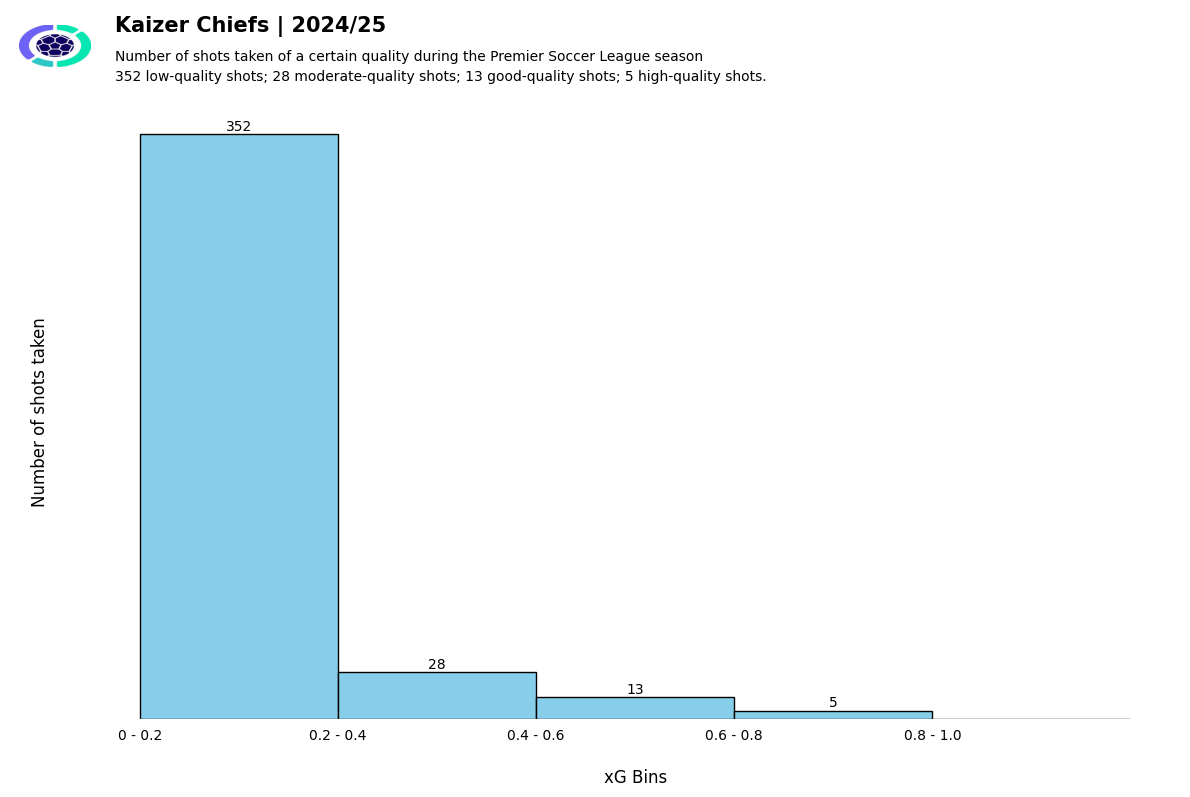
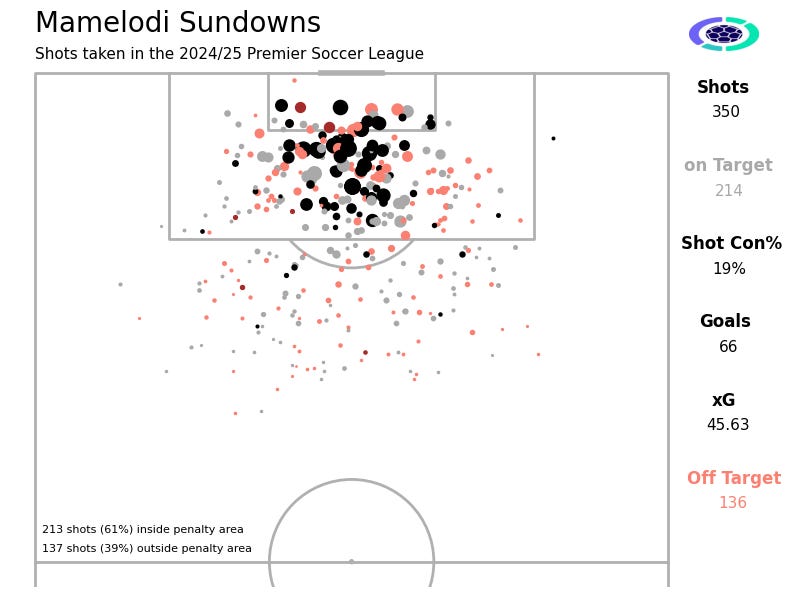
In other words, one in every five Sundowns shots is dangerous enough to lift fans off their seats; for Chiefs, it’s one in nine. The shot maps below illustrate the same point differently. Counting chances and shots taken alone is not enough. While Chiefs were league leaders in chance creation and shot taking, their 7% shot conversion (12th highest) remains alarming.
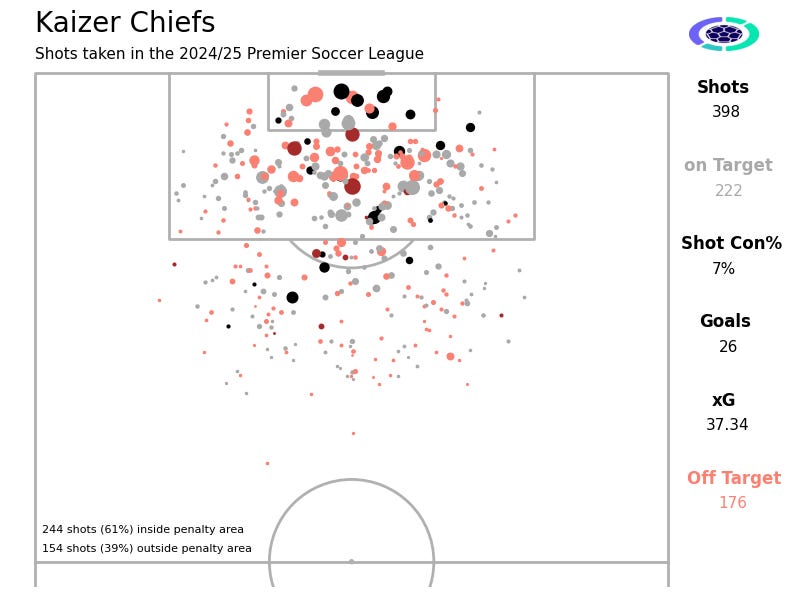
They are still in the Top 2 for aggregate xG, so one may argue that quality is not a problem, but due to their sheer high shot volume, this metric may present a distorted picture.
The Downs shot map has less white space in the box. They still convert way above average (19%), but is this a function of better shot selection (instead of massive shot volume)? Chiefs and Sundowns are in the same neighbourhood for xG totals (46-37 is a single-digit difference). Yet, they are on two different planets for goals scored (65-25 is a 40-goal difference).
Yes, Chiefs take the most shots — and by extension, create the most chances. Not every shot comes from a clearly defined “chance created,” but the difference is negligible (a topic for another day). It’s also important to consider game state, as it heavily influences shot volumes. After all, Chiefs trailed for 665 minutes this season (the 4th highest total among all teams this season), so a lot of these shots/chances came out of desperation to equalise or win games. The nine-game winless run (a first for Chiefs in over 20 years) would have added to that equation.
Chiefs were two shots shy of reaching the 400-shot mark at the end of the season (only 3 teams have done that in the last 5 years), but would they be better served taking fewer, more patient and better shots from more central locations? The next evolution of Chiefs may be pushing players to take the highest quality shots possible – taking higher value shots may result in more consistent scoring output.
