We could not start talking about Expected Points (xPts) before talking about expected presents (xPres). The rather infamous moment Craig Burley completely missed the point and started ranting at Gabriele Marcotti. The following is taken from the article:
“You’re talking to me about expected goals in the Champions League semifinal that they just lost? What an absolute load of nonsense that is!” Burley starts. Marcotti chimes in with a “Why?” and Burley’s rant continues to gain momentum: “What do you mean, why? I expect things at Christmas from Santa Claus, but they don’t come, right? What I deal in is facts!” Marcotti starts laughing and interjects “That’s not what it means!” and Burley responds, “Well, what does expected goals mean?” Marcotti says “Look, you can go on the internet and find a definition for it, but it’s one vantage point to measure how a team played, by looking at chances, chances created and whatnot,” and Burley interrupts “Look at the results!”
I find the Christmas part brilliant, Burley wonders why he doesn’t receive the presents he wants? Maybe he should learn to be kind first and then throw his toys out of the pram. But let’s move on.
Expected Points
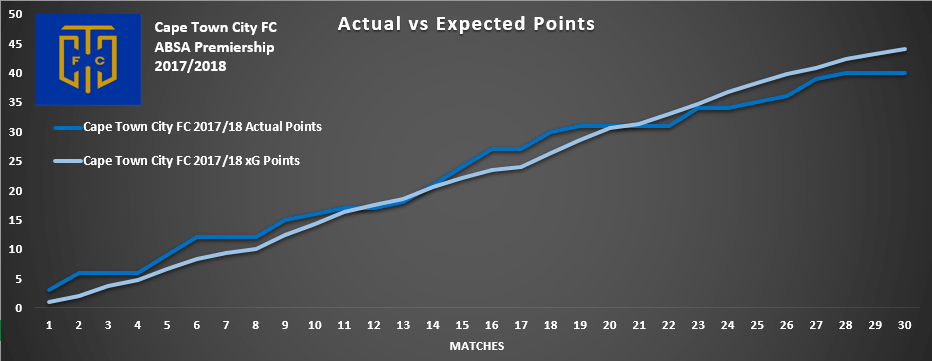
We have already seen that xG can show a team either under/over-performing throughout a period of time. xPts goes further and tells us ”how many points was Team A expected to get versus Team B”? Using this process we can estimate how a team is doing in comparison to their actual points (the league table). Take Cape Town City FC for example. Previously known as Mpumalanga Black Aces FC, the newly re-formed team (CTCFC) joined the PSL in 2016. This past season was a less successful (5th) than the previous season (3rd). But how? One explanation was the more intense fixture schedule such as attempting to qualify for the Caf Confederations Cup. This involved two legs of games with away trips to neighbouring countries Swaziland and Mozambique. It could have been worse with trips further up the continent. But there is the “why” also.
In short, the Citizens throughout the season did not produce great performances and results were unlucky at times. However, with xPts, we can see how this looks in comparison to their actual results/points.
 The graph above shows us three things:
- A season-long timeline of Cape Town City FC’s points acquired throughout the season.
- A season-long timeline of Cape Town City FC’s xPts points acquired throughout the season.
- The relationship between the two metrics throughout the season.
In essence, the early start of the season saw CTCFC pick up points at a quicker rate than we would have expected them too based on the xG that they “scored”. That followed a period where they were on point (game weeks 11 – 14). When the league returned after Christmas, the Citizens found a patch of form just as they had when the season started. This period did not last as long though. Since game week 23, they have struggled to find their winning ways and finished the season approximately 4 points under their “expected” total. While the campaign was obviously disappointing, these metrics work in conjunction with the teams’ performance. How might this look on a league-wide scale?

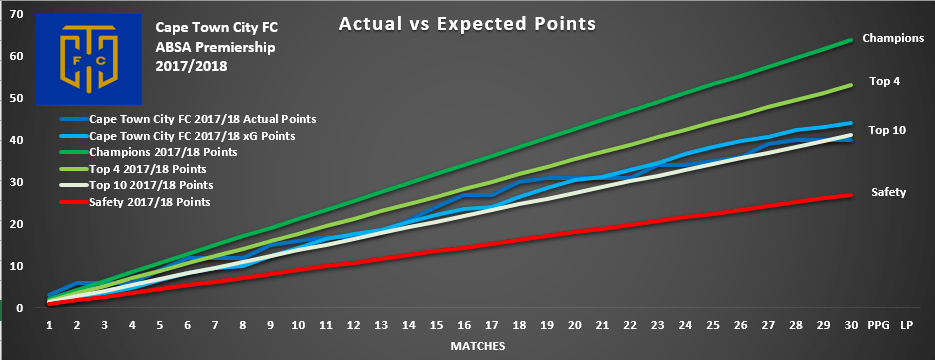
There are a number of things going on here. Let’s start with the labels (Champions, Top 4, Top 10 & Safety) on the right. We took final position points acquired from the league table of the last 5 PSL seasons . Then divided these down (for the positions) over the course of the season (per game week) to see “how many points” each position would have at the end of the season.
Champions: 63.9 points
Top 4: 53.1 points
Top 10: 41.1 points
Safety: 27 points
In order to win the PSL, teams needed to have around 63 points, while being safe from relegation required approximately 27 points. Obviously, this is a rough guide but it adds some context for clubs to consider and understand the requirements (or at least we hope). By plotting CTCFC’s actual points and xPts within this graph we are able to see how their season went.
The two blue lines between the Top 4 (light green) and Top 10 (white) lines represent ‘The Citizens’. Generally speaking, they never quite mounted a challenge for the title but the early part of the season did show moments where they could finish within the Top 4. After Christmas though is where it all went south. While the picked up points here or there, the first half of the season could not be replicated. It would certainly make for an interesting post-season analysis piece. Hopefully, we will have time before the season begins.
Conclusion
This post was longer than expected but we hope it helped demonstrate a point of how analytics can be helpful in evaluating teams (on this occasion) throughout the course of a season.

